Feature · Field Supervisor+
Progress tracked.
Office sees the site.
Track percentage complete by activity and phase. Photo-documented milestones. Visual timeline your owner, GC, and PM can see in real time — without driving to the job.
What it does
Activity-based progress tracking
- Define activities and phases for the job scope
- Log daily percentage complete per activity
- Remaining quantity and days-to-completion calculated
- Color-coded status by activity: not started / in progress / complete
Photo milestones
- Attach photos to progress updates
- Before/after documentation by phase
- Time-stamped and GPS-located photos
- Photo timeline visible to owner and GC via shared link
Timeline & forecasting
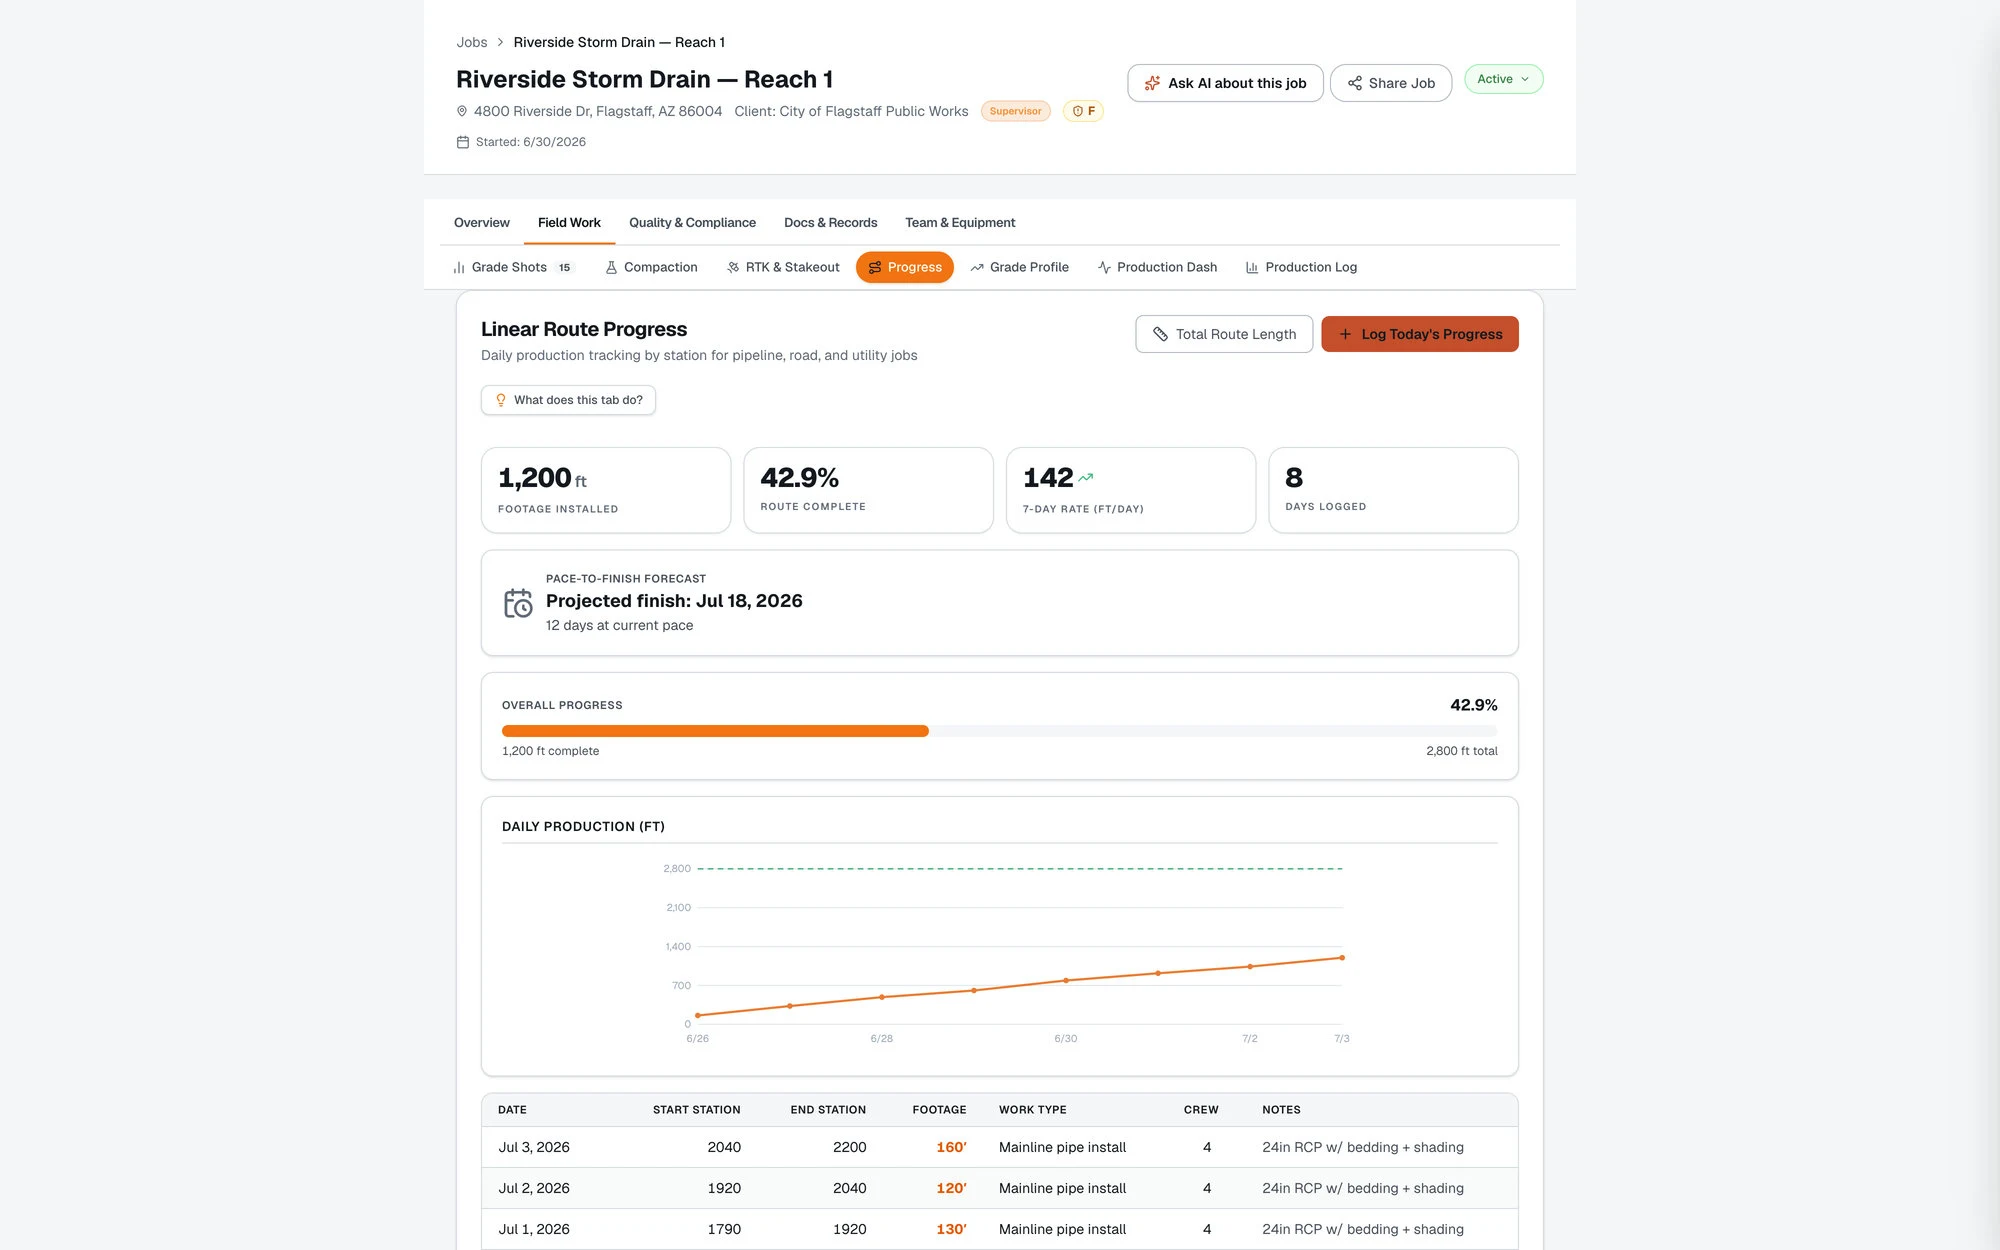
- Planned vs. actual progress by date
- S-curve progress visualization
- Ahead/behind schedule flagging by activity
- Projected completion date based on current burn rate
Stakeholder visibility
- Share progress report link — no login required for owner or GC
- Custom report cadence (daily, weekly, biweekly)
- Progress tied to production log quantities
- Activity notes and delay logging
How it works
01
Set up activities and milestones
Define the activities and phases for the job scope. Assign planned percentages by date or quantity.
02
Log daily progress
Each day, update the percentage complete per activity. Add notes and attach progress photos.
03
Share with stakeholders
Share the progress report link with your owner, GC, or PM. They see the current status and photo timeline without a site visit.
04
Track ahead/behind schedule
Gradelog shows you which activities are trending behind and forecasts completion based on current burn rate. Address issues before they compound.
Who uses this
Superintendents
Update progress in 5 minutes at end of day. Owner and GC see the site status without calling you every morning.
Project managers
Planned vs. actual progress across all active jobs in one dashboard. Catch schedule slippage early.
Owners & developers
Real-time progress visibility — no monthly progress meetings required to know if the job is on track.
Built for your industry
Common questions
What is the difference between Progress Tracking and Production Log?
Progress Tracking is activity-based — percentage complete by phase or scope item. The Production Log is quantity-based — daily units placed vs. bid quantities. Many contractors use both: production for daily quantities, progress for milestone and schedule tracking.
Can owners see progress without a Gradelog account?
Yes. Share a link to the progress report. The owner, GC, or lender can view current status, photo milestones, and the progress timeline without creating an account.
How is the projected completion date calculated?
Gradelog calculates a completion forecast based on your recent daily burn rate vs. remaining scope. If burn rate drops, the forecast shifts — giving you early warning that the schedule needs attention.
Can I log delay events in the progress module?
Yes. Delay events (weather, material shortage, access issues, etc.) can be logged per activity per day. Delays are included in the progress report and can be used to support schedule extension requests to the owner or GC.